Introduction
In 2025, the most successful recruiting teams are those that are data-driven — the ones tracking their Recruitment KPIs consistently outperform everyone else.
According to LinkedInʼs Global Talent Trends report, companies with mature analytics practices in recruitment and talent acquisition are 2x more likely to improve their recruiting efficiency and 3x more likely to reduce cost per hire. Meanwhile, research from Deloitte shows that organizations using advanced recruitment metrics see a 38% improvement in quality of hire and reduce time-to-fill by 34%. Thatʼs not just an edge — it’s the difference between building winning teams and watching top talent join your competitors.
For recruitment leaders drowning in applications but starving for actual talent, understanding which KPIs to track can transform your entire talent acquisition process. But here’s the problem: most teams are tracking vanity metrics that look impressive in quarterly reports but don’t actually drive better hiring decisions.
I learned this the hard way. We were celebrating hitting our “applications received” targets while our engineering team wasted 47 hours that month interviewing unqualified candidates. Our top sales candidate ghosted us after a terrible interview experience. And that “perfect” product manager we’d hired? They lasted exactly 73 days before leaving for a competitor who moved faster.
That painful realization led to building JusRecruit and discovering the five recruitment KPIs that actually predict hiring success. These arenʼt vanity metrics — they’re the data-driven recruitment metrics that reveal the true health of your talent acquisition process and help you consistently attract, assess, and retain top talent.
In this guide, we’ll explore the five essential KPIs that every recruiting leader should be monitoring:
- Time to Hire – why every extra day costs you top talent (and how to cut yours by 50% using AI phone screens)
- Quality of Hire – the only metric that truly matters, with a practical framework that actually works
- Cost per Hire – including the hidden costs that are destroying your budget
- Candidate Experience Score – the metric that predicts whether you’ll win or lose the talent war
- Screening Efficiency – how AI-powered screening in recruitment changes everything (when configured correctly)
These recruitment metrics will help you measure what matters, optimize your hiring process, and build a data driven recruitment strategy that consistently delivers quality talent.
Let’s dive in.
Quick Snapshot / TL;DR
The 5 Essential Recruitment KPIs at a Glance:
| KPI | What it Measures | Target Benchmark |
|---|---|---|
| Time to Hire | Days from job post to offer acceptance | 25–30 days (tech roles) |
| Quality of Hire | New hire performance & fit | 80%+ of hires rated “meets expectations” after 6 months |
| Cost per Hire | Total hiring cost ÷ number of hires | ≤ ₹60 K for SMBs; ₹1 L for mid-market |
| Candidate Experience Score | Candidate NPS or CSAT post-process | +40 NPS or 80% CSAT |
| Screening Efficiency | % of screened candidates that advance to interview | 15–25% (pass rate) |
Why the Right KPIs Matter in 2025

The hiring landscape has fundamentally shifted. Remote work didn’t just expand your talent pool, it intensified competition to a global scale. That senior developer you’re trying to hire? They’re getting 15 LinkedIn messages a day and comparing your 6-week process to a competitor who makes offers in 10 days.
Meanwhile, AI has invaded recruitment. But here’s what most recruiting leaders get wrong: implementing AI screening without the right KPIs is like driving blindfolded at 100mph. You might move fast, but you’re heading for a crash. Teams that still rely heavily on manual hiring processes instead of embracing recruitment automation often struggle to maintain consistency and speed in their pipelines.
We’ve seen companies implement AI tools that reject 95% of candidates (too strict) or pass through 80% (too loose), both destroying their hiring outcomes. Tracking the right recruitment KPIs helps teams identify what actually moves hiring outcomes.
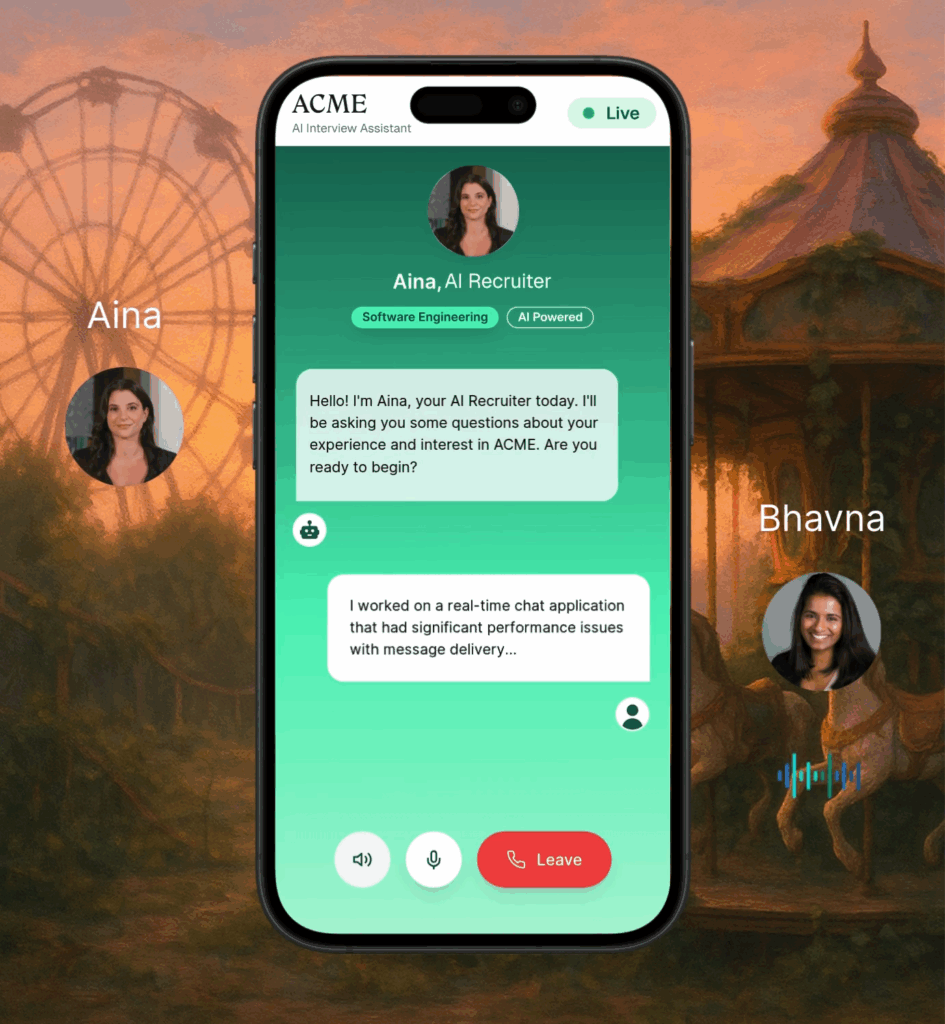
At JusRecruit, we learned this the hard way. Before we built our AI interviewer Saina, we tracked traditional metrics: number of interviews conducted, resumes processed, positions filled. These numbers looked great in quarterly reports but didn’t answer the question that actually mattered: were we getting the right people in the door, fast enough, without burning through our budget or burning out our team?
The shift to data-driven recruitment isnʼt optional anymore. Recent data shows that 65% of companies now use AI in recruitment, but only 23% properly measure its impact. Without tracking the right recruitment KPIs, you canʼt tell if your fancy new AI tools are helping or creating new problems. These five recruitment metrics are your compass in the new world of AI-powered talent acquisition.
The 5 Recruitment KPIs Every Talent Acquisition Team Should Track
1. Time to Hire
Definition:
Time to Hire measures the days between posting a job and a candidate accepting your offer.
Why it matters
Here’s a stat that should terrify you: the best candidates are off the market in 10 days. Not 10 weeks. Days. Every additional day in your process increases the chance that your top choice accepts another offer. We’ve calculated that each day of delay costs companies $500-$1,500 in lost productivity, plus the invisible cost of competitor advantage when they snap up the talent you’re still “considering.”
Formula:
Time to Hire = Offer Acceptance Date − Job Posting Date
Real JusRecruit Example:
| Stage | Traditional Process | With JusRecruit |
|---|---|---|
| Job Posted | Day 1 | Day 1 |
| Resume Screening | Day 5–7 | Day 1 (AI vetting) |
| Phone Screens | Day 10–14 | Day 2–3 (AI Phone Screen) |
| First Interview | Day 18–20 | Day 5–6 |
| Final Interview | Day 25–28 | Day 9–10 |
| Offer Extended | Day 30–32 | Day 12–13 |
| Total Time to Hire | 32–35 days | 13–15 days |
How to measure
For manual tracking, timestamp each stage in your ATS or spreadsheet. The key is consistency, always measure from the same starting point (we recommend job posting date, not requisition approval).
Practical improvement tactics:
- Deploy AI-powered screening immediately: Our AI Phone screening can screen candidates within days of application, not weeks
- Eliminate sequential bottlenecks: Run reference checks parallel to final interviews, not after
- Create “fast track” paths: For roles you hire repeatedly, pre-approve comp ranges and skip unnecessary steps
- Set 24-hour SLAs: Every delayed decision adds 2-3 days to your overall timeline
- Maintain warm talent pools: Use our pre-vetted candidate pool to start with qualified, interested candidates
Example
TechStartup implemented JusRecruit’s AI screening for their engineering roles. Saina conducted first-round technical interviews automatically, reducing their Time to Hire from 38 to 14 days. They made an offer to a senior engineer before their competitor even scheduled a first interview. That engineer? Now their VP of Engineering, directly attributing their decision to join to the company’s “refreshingly efficient” process.
Set up AI phone screen
With JusRecruit, you can use AI phone screens to cut your screening time from 2 weeks to mere 3 days.
2. Quality of Hire
Definition:
Quality of Hire measures whether your new employees actually succeed in their roles. It’s the ultimate validation of your entire recruitment process.
Why it matters:
A bad hire isn’t just a missed opportunity, it’s a disaster that compounds. They drain manager time, demotivate top performers, and can take 6+ months to exit. Our data shows that companies using proper quality measurement (not just gut feel) improve their hiring success rate by 43%. This is why we built Saina to evaluate not just skills, but cultural fit and growth potential.
Formula:
Quality of Hire = (Performance Score + Retention Score + Productivity Score) / 3
JusRecruit Scoring Framework:
| Metric | Weight | How We Measure | Score Calculation |
|---|---|---|---|
| 90-Day Performance | 33% | Manager rating (1–5) + Saina prediction accuracy | Convert to 0–100 |
| 6-Month Retention | 33% | Still employed + engagement score | Binary (0 or 100) |
| Ramp-to-Productivity | 33% | Days to first meaningful contribution | 100 × (Target / Actual) |
How to measure:
Create a simple feedback loop: track which candidates scored highest in your process and whether they succeeded long-term.
Practical improvement tactics:
- Use structured AI interviews: Saina asks the same core questions, eliminating interviewer bias
- Test actual skills, not keywords: Our platform includes role-specific simulations and technical assessments
- Track predictor accuracy: Monitor which interview signals (technical skills, communication, culture fit) best predict success
- Improve pre-boarding: Send new hires resources and connections before day one
- Create feedback loops: Use performance data to continuously refine your AI screening criteria
Example:
When an e-commerce company started using JusRecruit, they discovered their traditional interviews overweighted presentation skills and undervalued problem-solving ability. After recalibrating their scoring rubrics, their Quality of Hire metric improved from 68% to 89%. New customer service reps now handle 40% more tickets successfully in their first month.
3. Cost per Hire
Definition:
Cost per Hire calculates your total investment to fill a position, including visible costs (job boards, tools) and hidden costs (team time, opportunity cost).
Why it matters:
Most companies dramatically underestimate their true Cost per Hire because they ignore internal costs. We’ve seen startups spending $15,000+ per hire when they thought it was $3,000. That’s money that could fund better tools, higher salaries, or improved candidate experience. With JusRecruit automating early-stage screening, companies typically cut their Cost per Hire by 40-60%.
Formula:
Cost per Hire = (Internal Costs + External Costs + Opportunity Costs) / Total Hires
JusRecruit Cost Comparison:
| Cost Category | Traditional Recruiting (₹) | With JusRecruit (₹) |
|---|---|---|
| External Costs | ||
| Job Board Posting | ₹ 10,000 | ₹ 10,000 |
| Agency Fees (if used) | ₹ 1,20,000 – ₹ 2,25,000 (≈ 8%–15% of annual CTC) (Placement India) | ₹ 0 (use pre-vetted pool) |
| Assessment Tools | ₹ 4,000 | Included |
| Background Checks | ₹ 6,000 | ₹ 6,000 |
| Internal Costs | ||
| Recruiter Screening Time | ₹ 1,60,000 (≈ 40 hours × ₹ 4,000/h) | ₹ 16,000 (≈ 4 hours × ₹ 4,000/h) |
| Phone Screens | ₹ 80,000 (≈ 20 hours × ₹ 4,000/h) | ₹ 0 (Saina handles) |
| Engineering Interview Time | ₹ 2,40,000 | ₹ 80,000 (only qualified candidates) |
| Coordination / Admin | ₹ 40,000 | ₹ 8,000 (automated scheduling) |
| Total Average | ₹ 7,56,000 | ₹ 1,20,000 |
How to measure:
Track all recruitment-related expenses in a simple spreadsheet. Include: recruiter salary (prorated by time spent per hire), interviewer time (hourly rate × hours spent), all tools and subscriptions (divided by monthly hires), and opportunity cost of unfilled roles.
Practical improvement tactics:
- Replace agencies with AI: Our pre-vetted talent pool eliminates most agency needs
- Automate phone screening: our AI phone screen can handle any number of phone screens daily at no marginal cost.
- Reduce interview loops: Better early screening means fewer wasted late-stage interviews
- Track source ROI: Our analytics show which channels deliver quality, not just quantity
- Batch similar roles: Use Saina’s consistent evaluation to build talent pools for repeat positions
Example:
A SaaS startup was spending $20,000 per engineering hire, mostly on agency fees and extensive interview loops. After implementing JusRecruit, Saina handled all initial technical screens, identifying the top 20% of candidates. Their Cost per Hire dropped to $4,500 while their Quality of Hire actually improved they were seeing better candidates, just more efficiently.
4. Candidate Experience Score
Definition:
Candidate Experience Score measures how applicants perceive your hiring process, regardless of outcome. We typically use Net Promoter Score (NPS) methodology.
Why it matters:
Here’s what keeps me up at night: every candidate you ghost or frustrate tells 10 friends. In our hyper-connected world, your candidate experience IS your employer brand. Bad experiences don’t just cost you that candidate they cost you their entire network. Conversely, even rejected candidates who have a great experience become talent ambassadors. That’s why we designed Saina to provide immediate engagement and feedback.
Formula:
Candidate NPS = % Promoters (9-10 rating) - % Detractors (0-6 rating)
How to measure:
Send a survey 48 hours after any candidate interaction, ensuring high response rates. You can segment responses by outcome (hired, rejected at various stages) to identify specific pain points. The key is surveying everyone, not just hires rejected candidates often provide the most valuable feedback.
Practical improvement tactics:
- Provide instant acknowledgment
- Set clear expectations: Our platform shows candidates exactly where they stand in the process
- Deliver value regardless of outcome: Saina provides constructive feedback to help candidates improve
- Respect their time: AI screening means no more redundant questions across multiple interviews
- Close the loop professionally: Even automated rejections can be personalized and helpful
5. Screening Efficiency
Definition:
Screening Efficiency measures how effectively your initial filters identify qualified candidates while filtering out poor fits. It’s your funnel optimization metric.
Why it matters:
This is where most companies fail with AI recruitment. Set filters too tight, and you’ll miss hidden gems. Too loose, and you’re back to drowning in noise. The goal isn’t to filter out the most people, it’s to surface the right people. Our data shows that optimized screening efficiency can reduce time-to-hire by 50% while improving quality of hire by 30%.
Formula:
Screening Efficiency = (Candidates Advancing to Interview / Total Applicants) × 100
JusRecruit Funnel Benchmarks:
| Stage | Volume | Pass Rate | What It Means |
|---|---|---|---|
| Applications Received | 200 | 100% | Your reach |
| AI Resume Vetting | 100 | 50% | Basic qualification |
| Saina AI Interview | 45 | 45% | Skill + culture fit |
| Recruiter Review | 30 | 67% | Human validation |
| Hiring Manager Interview | 15 | 50% | Technical deep dive |
| Final Interview | 8 | 53% | Team fit |
| Offer Extended | 3 | 38% | Multiple strong candidates |
| Offer Accepted | 2.5 | 83% | Competitive offers |
How to measure:
Track conversion rates at each stage, but focus on the correlation between early screening scores and eventual hiring success. The key insight: monitor not just pass rates, but pass quality.
Practical improvement tactics:
- Calibrate AI weekly: Review false positives/negatives and adjust Saina’s evaluation criteria
- Use role-specific assessments: Generic filters miss role-specific excellence
- Set smart thresholds: Our platform recommends optimal pass rates based on role difficulty and market conditions
- Create feedback loops: Track which Saina scores correlate with interview success
- A/B test screening criteria: Experiment with different weights for skills vs. culture vs. experience
Example:
An HR tech company’s screening was passing 75% of applicants, overwhelming their recruiters with mediocre candidates. We helped them reconfigure Saina to evaluate problem-solving ability and communication skills, not just keyword matches. The new 48% pass rate seems stricter, but interview-to-offer ratios improved from 12:1 to 4:1. So now they’re seeing fewer candidates but making more hires. Now that’s true screening efficiency.
How to Build a Recruitment KPI Dashboard
Let me be blunt: if your hiring KPIs live in scattered spreadsheets that get updated “when someone has time,” you don’t actually have KPIs. You have good intentions. Real measurement requires a living, breathing dashboard that your entire team actually uses.
The JusRecruit Dashboard Philosophy:
We built our analytics dashboard based on a simple principle: if it takes more than 5 seconds to understand, it’s too complicated. Your recruitment dashboard should tell a story at a glance: Are we hiring fast enough? Are we hiring the right people? Are we doing it efficiently?
Essential Dashboard Components:
Start with the “North Star” view, a single screen showing all five KPIs with traffic light indicators (red/yellow/green). Below that, add trend lines showing the last 90 days of performance. Include a funnel visualization that shows where candidates drop off and why. Finally, create a source effectiveness heat map showing which channels deliver quality, not just quantity.
Recommended Tools:
If youʼre building your own recruitment KPI dashboard, Google Looker Studio remains the best free option.
For more sophisticated needs, consider Tableau or Power BI, though the learning curve is steeper. Whatever you choose, automation is crucial while manual updates are the death of good metrics.
Implementation Best Practices:
Schedule a weekly 15-minute metrics review. Make it sacred time – no excuses, no rescheduling. Share the dashboard broadly; transparency drives accountability. Most importantly, tie metrics to action. If Time to Hire creeps up, what specifically will you change? If Quality of Hire drops, what’s your intervention plan?
Pro tip from our own experience: celebrate improvements publicly but discuss problems privately. When our Screening Efficiency improved by 15%, we announced it company-wide. When Candidate Experience dipped, we huddled with the recruiting team to fix it fast.
Playbook: What to Do When a KPI Is Off
KPIs without action plans are just depressing numbers. Here’s exactly what to do when each metric signals trouble.
The Diagnostic Framework:
When a KPI drops, resist the urge to panic or overhaul everything. Instead, follow our
FAST framework:
- Find the bottleneck (where exactly is the problem?),
- Analyze the root cause (why is it happening?)
- Solve with minimal change (what’s the smallest effective fix?)
- Track the impact (did it work?).
Time to Hire Crisis Response:
If your Time to Hire exceeds 30 days, you’re losing top talent. Period. Start by running a stage-by-stage analysis where does time accumulate? Screening takes more than 3 days? Implement AI phone screens for faster talent shortlists. If scheduling causes delays, use automated booking tools. If decision-making drags, create pre-approved offer parameters. Most critically: set and enforce SLAs. Our rule: 24 hours for each human decision, no exceptions.
Quality of Hire Intervention:
When new hires fail consistently, the problem usually starts at the job description. Are you attracting the right candidates? Next, examine your screening criteria you might be optimizing for the wrong signals. Review Saina’s interview questions: do they test actual job requirements or generic skills? Add work simulations for critical roles. Finally, audit your onboarding sometimes “bad hires” are just good hires who were set up to fail.
Candidate Experience Recovery:
An NPS below 30 is a fire alarm. Start by reading every single piece of feedback from the last 30 days patterns emerge quickly.
Final Thoughts
After years of watching talented teams burn out on broken hiring processes, we built JusRecruit to solve a simple problem: how do you measure and improve what actually matters in recruitment?
These five KPIs aren’t just metrics, they’re your roadmap to building a hiring process that consistently delivers quality talent without destroying your budget or your team’s sanity. Start with one or two metrics, get the rhythm of measurement and improvement, then expand.
Remember our mission: give recruiters no fluff, just talent. The same applies to metrics. Stop tracking vanity numbers that impress nobody and start measuring what moves the needle.
Ready to transform your recruitment metrics?
Start with AI Phone Screens
With JusRecruit, you can use AI phone screens to cut your screening time from 2 weeks to mere 3 days.
FAQ
Can AI screening improve recruitment KPIs?
Absolutely, when configured correctly. Our data shows AI screening can reduce Time to Hire by 50-70% and Cost per Hire by 40-60%. The key is proper calibration. Saina learns from every interaction, continuously improving her ability to identify quality candidates.
What is the most important recruiting KPI?
Quality of Hire drives everything else. You can hire fast and cheap, but if those hires fail, you’re actually moving backward. Focus on quality first, then optimize for speed and cost. At JusRecruit, predictive accuracy for Quality of Hire is our north star metric.
How often should I measure recruitment KPIs?
Time to Hire and Screening Efficiency: track daily, report weekly. Cost per Hire: calculate monthly. Quality of Hire: measure at 90 days post-hire. Candidate Experience: survey continuously, analyze monthly. This cadence balances real-time insights with meaningful sample sizes.
How do I measure quality of hire effectively?
Combine three objective data points: 90-day performance ratings, 6-month retention, and time-to-productivity. If you’re using JusRecruit, we automatically correlate Saina’s interview scores with these outcomes to continuously improve predictions.
How does screening in recruitment impact other KPIs?
Screening efficiency is the multiplier metric — it impacts everything else. Better screening means faster time to hire (fewer interviews needed), lower cost per hire (less time wasted), higher quality of hire (better candidate identification), and improved candidate experience (faster, more transparent process).
How does screening in recruitment impact other KPIs?
Screening efficiency is the multiplier metric it impacts everything else. Better screening means faster time to hire (fewer interviews needed), lower cost per hire (less time wasted), higher quality of hire (better candidate identification), and improved candidate experience (faster, more transparent process).